Gold and silver sit side by side in every jeweler’s window and every precious metals portfolio, making it easy to assume they behave the same way. They don’t do that. The differences between them—in volatility, in demand drivers, in what moves their prices and when—are significant enough that choosing between them or deciding how to split the allocation requires understanding each on its own terms.
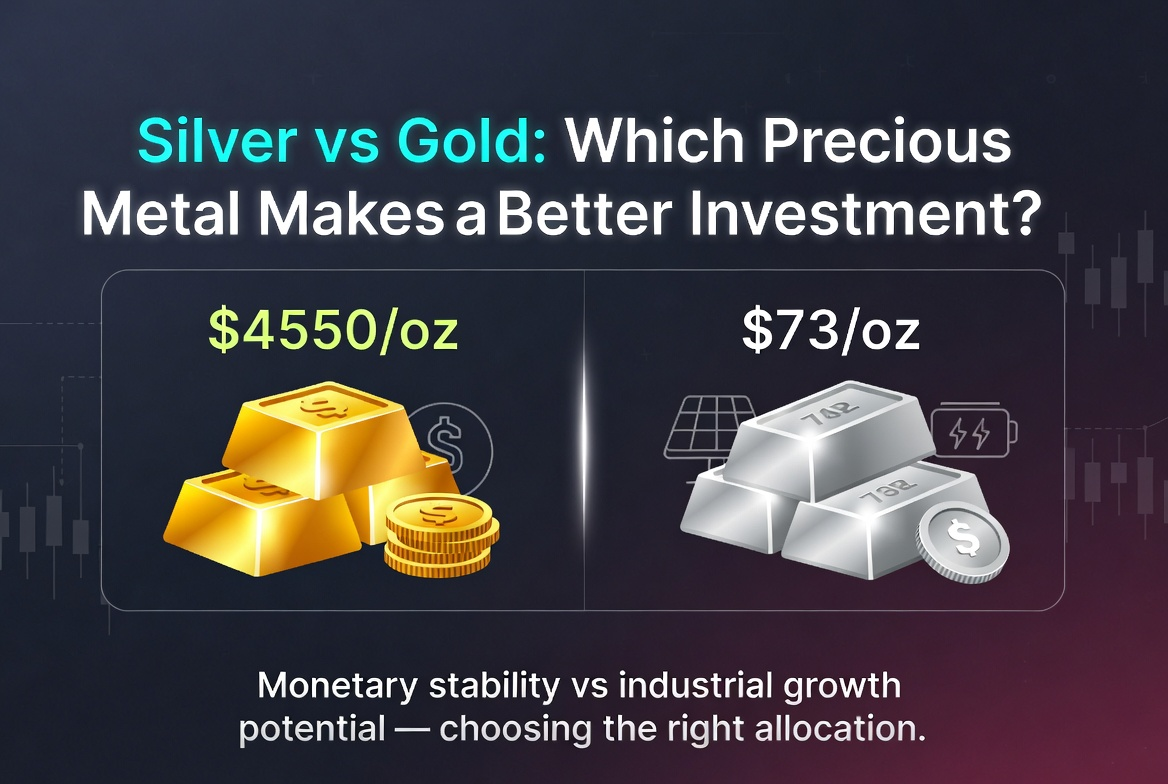
Both metals hit all-time highs in early 2026. Gold peaked at approximately $5,589 an ounce in late January. Silver surpassed $100 an ounce for the first time in history, reaching $121.64 on January 29. Since then, both have pulled back sharply, with gold trading in the $4,500 to $4,600 range and silver around $73 to $74 since early May 2026. That context is important. The question for investors is not which metal has appreciated more – but which one suits your portfolio and risk tolerance over the next few years.
 What drives gold: the monetary metal
The investment case for gold rests on foundations that have existed for five thousand years. About 90% of gold demand comes from investments, central bank reserves and jewelry – industrial applications account for only about 5% of annual consumption. This means that the price of gold is driven almost entirely by monetary factors: inflation expectations, real interest rates, fears of currency decline and geopolitical risk.
Central banks have been accumulating gold at record rates. The diversification of reserves away from the US dollar – fueled by geopolitical realignment and the use of dollar-based financial sanctions as a political tool – has created a structural supply for gold at an institutional level that did not exist to the same extent a decade ago.
Gold is a metal of lower volatility. The annual standard deviation of gold price returns hovers around 18%, compared to approximately 35% for silver. During stock market pullbacks, gold has historically maintained a low or negative correlation with stocks, functioning as a true portfolio hedge rather than just another risk asset that falls in a crisis. BlackRock describes it as “strategic ballast” rather than a growth instrument, and that’s roughly correct.
The limitation is precisely this stability. Gold rarely delivers explosive growth in a bull market. Guards wealth; it typically does not multiply it.
What drives silver: A hybrid metal
Silver operates in two worlds simultaneously, and this dual nature is what makes it more interesting and complicated than gold.
About 60% of annual silver consumption is industrial – a share that is growing, not decreasing. Each solar panel requires approximately 20 grams of silver paste to collect and transmit electricity. Electric vehicles consume 67-79% more silver per unit than cars with internal combustion engines. AI data centers require silver for server connectivity and cooling systems. Electronics consume about 445 million ounces of silver annually. Unlike gold, which is largely endlessly recycled through the economy, industrial silver is permanently consumed – it becomes part of the product and is rarely renewed.
JP Morgan predicts an average silver price of $81 an ounce in 2026. The Silver Institute predicts demand for automotive silver to grow at a CAGR of 3.4% through 2031. The structural demand story here is real and persistent – not dependent on investor sentiment. When solar installations and electric vehicle production continue regardless of whether financial markets are jittery, silver has an underlying industrial demand that gold simply does not have.
The investment demand side for silver is more volatile. When precious metals markets accelerate, retail and institutional money flows into silver in waves that—given its much smaller market than gold—produce dramatic price moves. Silver moves 2-3 times more dramatically than gold in both directions. It crashed harder in 2008 and recovered faster in 2009-2011. The pattern has repeated itself through every major cycle of the precious metals.
The ratio of gold to silver: a practical tool
The ratio between the two prices tells you something useful about relative value. Historically, the ratio of gold to silver has averaged between 50:1 and 80:1. When the ratio rises above 80:1, silver is historically cheap relative to gold and tends to outperform in the coming period. When it falls below 60:1, gold offers better relative value.
The ratio is currently approximately 61-62:1, which puts the two metals close to historical fair value relative to each other. There is no dramatic rotation at current levels, although the ratio is worth monitoring over the coming years as the industrial demand story develops.
The table below summarizes the key differences between the two metals in the dimensions most important to investment decisions:
| Dimension | Gold | Silver |
| Price (May 2026) | ~$4500-4600/oz | ~$73-74/oz |
| The primary driver of demand | Investments, central banks (90%) | Industrial applications (60%) |
| volatility | Lower (~18% annual standard development) | Higher (~35% annual standard development) |
| Role portfolio | Stability, protection against inflation | Growth potential, industrial exposure |
| Liquidity | Very high | High but smaller market |
| Storage of 100 thousand dollars | ~22 oz, compact | ~1400 oz, considerable weight |
| Central bank purchase | Yes, at record levels | Not |
| Green energy connection | Minimally | Direct and growing |
Which one to choose
The honest answer is that the question is usually wrong. Most experienced precious metals investors hold both, weighted towards gold for stability with a tactical allocation to silver for upside exposure. A typical recommended split among analysts is approximately 70% gold and 30% silver for a balanced allocation of precious metals.
The case for weighting gold is strongest for investors who prioritize capital preservation, who are nearing retirement and cannot absorb sharp drawdowns, or who want true portfolio protection that preserves value during stock market stress. At any price level, gold does this more reliably than silver.
The case for weighting silver is strongest for investors with a longer time horizon, who want exposure to the green energy transition through commodities rather than equities, and who accept that higher volatility costs higher potential returns. The story of industrial demand for Silver comes together in years, not quarters.
For those who follow live price movements and track the ratio in real time, silver price in dollars the chart provides live data along with technical analysis tools to help with timing and dynamic tracking of gold and silver ratios.
Conclusion
Gold and silver are complements, not competitors. Gold offers a proven safe-haven premium, central bank demand support and the lower volatility needed to preserve wealth. Silver offers greater explosive potential underpinned by a story of structural industrial demand for solar, electric and AI infrastructure that gold can’t match.
Choosing between them is ultimately a question of what role you want precious metals to play in your portfolio. If the answer is stability and insurance, gold deserves a greater allocation. If the answer includes significant exposure to the green energy transition with the potential for stronger upside, silver deserves a place alongside it.